Core Web Vitals & Performance Monitoring
Real-time and historical tracking of website performance metrics that impact user experience and search rankings
Overview
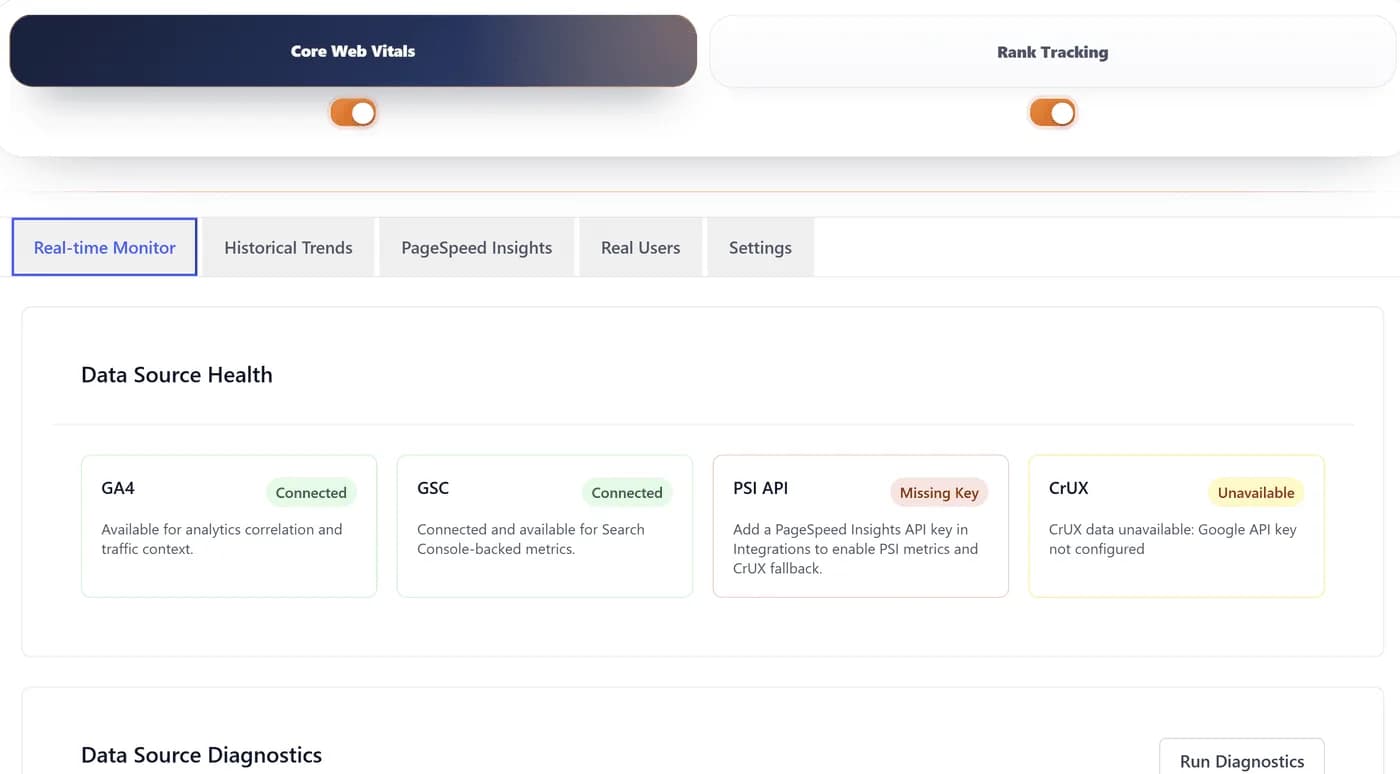
The Core Web Vitals & Performance monitoring feature provides comprehensive tracking of your website's performance metrics using Google's PageSpeed Insights API and Chrome User Experience Report (CrUX) data.
Real-Time Monitoring
Live Core Web Vitals tracking with device-specific analysis
Historical Data
30-day trend analysis with performance score tracking
CrUX Integration
Real user experience data from Chrome browsers
Prerequisites
- ✓ProRank SEO Business, Agency, or Pro+ License - Required for Core Web Vitals monitoring
- ✓SSL Certificate - HTTPS required for accurate CrUX data
- ○PageSpeed Insights API Key - Optional, for higher quotas
Initial Setup
- Navigate to ProRank SEO → Analytics → Core Web Vitals & Performance
- The dashboard automatically begins collecting data for your homepage
- Use the URL selector dropdown to monitor specific pages
- Toggle between Mobile and Desktop views using the device selector
Understanding Core Web Vitals
Core Web Vitals are a set of metrics that measure real-world user experience for loading performance, interactivity, and visual stability of the page.
| Metric | Measures | Good | Needs Improvement | Poor |
|---|---|---|---|---|
| LCP (Largest Contentful Paint) | Loading performance | ≤ 2.5s | 2.5-4.0s | > 4.0s |
| INP (Interaction to Next Paint) | Responsiveness | ≤ 200ms | 200-500ms | > 500ms |
| CLS (Cumulative Layout Shift) | Visual stability | ≤ 0.1 | 0.1-0.25 | > 0.25 |
Supporting Metrics
When first text or image is painted
Server response time
How quickly content is visually displayed
Dashboard Features
🩺 Performance Doctor (AI-Powered)
- • Automatic detection of performance issues from PageSpeed Insights audits
- • Real-time analysis with severity levels (Critical/Moderate/Minor)
- • One-click auto-fix for supported issues (image optimisation, caching, etc.)
- • Business impact calculator showing load time, bounce rate, and revenue improvements
📊 Real-time Monitor
- • Live Core Web Vitals values from PageSpeed Insights API
- • All 6 metrics: LCP, INP, CLS, FCP, TTFB with thresholds
- • Performance score visualization (0-100)
- • Auto-refresh every 30 seconds option
- • Device-specific testing (Mobile/Desktop)
🏆 Competition Analysis
- • Compare your site with up to 5 competitors
- • Real-time fetching of competitor Core Web Vitals
- • Side-by-side performance comparison table
- • Automatic insights on performance gaps
- • Identifies specific areas where competitors excel
📈 Historical Trends
- • 30-day performance timeline with interactive charts
- • Track improvements over time
- • Detailed values on hover
- • Data persistence in database
🎯 Fix & Optimise
- • Specific optimisation recommendations from PageSpeed audits
- • Priority-ordered improvements based on impact
- • Direct integration with performance optimisation modules
👥 Real Users Data (CrUX)
- • Chrome User Experience Report integration
- • 75th percentile real user metrics
- • Origin-level and URL-level data when available
- • Pass rate calculations
API Key Configuration
While ProRank provides a default API key, you can use your own PageSpeed Insights API key for higher quotas:
1. Go to ProRank SEO → Analytics → Integrations Setup
2. Click on the PageSpeed Insights card
3. Enter your API key and click Save
4. System will verify and confirm connectionHow It Works
🔄 Data Flow
- Dashboard sends request to ProRank REST API endpoints
- API calls Google PageSpeed Insights v5 with your URL
- PageSpeed returns both lab data (Lighthouse) and field data (CrUX)
- Data is parsed, stored in database, and displayed in real-time
- Performance Doctor analyses audit failures to create actionable issues
🎯 Performance Doctor Analysis
The AI-powered Performance Doctor automatically:
- Scans all PageSpeed Insights audit results
- Identifies audits with scores below 0.9 (failed audits)
- Maps failed audits to specific fixable issues
- Calculates real business impact based on your metrics
- Provides one-click fixes for supported optimisations
🏁 Competition Analysis Process
- Enter competitor URLs (up to 5)
- Click "Analyse Competitors"
- System fetches real-time CWV data for each URL
- Displays side-by-side comparison with color coding
- Generates insights based on performance differences
Performance Optimisation Tools
Image Optimisation
- ✓ WebP Conversion
- ✓ Lazy Loading
- ✓ Responsive Images
JavaScript Optimisation
- ✓ Defer JavaScript
- ✓ Remove Unused JS
- ✓ Delay JavaScript
CSS Optimisation
- ✓ Critical CSS
- ✓ Remove Unused CSS
- ✓ Minification
Caching Configuration
- ✓ Page Caching
- ✓ Browser Caching
- ✓ CDN Integration
Troubleshooting
No Data Appearing
Dashboard shows "No data available"
- • Verify site is publicly accessible
- • Check HTTPS configuration
- • Wait 5-10 minutes for initial collection
- • Ensure JavaScript is enabled
CrUX Data Not Available
No Chrome UX Report data for URL
- • CrUX requires 1000+ visits/month
- • Use origin-level data instead
- • Focus on lab data from PSI
API Rate Limits
API quota exceeded error
- • Use your own PSI API key
- • Reduce monitoring frequency
- • Limit monitored URLs
- • Enable caching (1-hour minimum)
Best Practices
Optimisation Priority
- 1. Fix red metrics first
- 2. Mobile-first approach
- 3. Monitor after changes
Testing Methodology
- 1. Run multiple tests
- 2. Test different times
- 3. Test various locations
Continuous Monitoring
- 1. Daily key pages
- 2. Weekly analysis
- 3. Monthly reports
Frequently Asked Questions
Why do lab data and field data differ?
Lab data represents controlled testing conditions, while field data reflects real user experiences with varying network conditions, devices, and behaviors.
How often should I run performance tests?
For active optimisation: test after each change. For monitoring: daily automated tests are sufficient. Weekly deep analysis recommended for trend tracking.
Which metrics are most important for SEO?
All three Core Web Vitals (LCP, INP, CLS) are ranking factors. Google requires passing all three for the full ranking benefit. Focus on failing metrics first.