Content Decay Monitor
Track and prevent content performance decline using Google Search Console data
Overview
The Content Decay Monitor uses real Google Search Console data to identify content losing search traffic over time. It provides two main views: a Dashboard tab that runs decay analysis comparing Search Console periods and displays decline metrics (Traffic Change, Impressions, CTR Change, Position, Severity), and an Analytics tab with chart visualisations of the same data.
Decay Detection
Identify declining content automatically
Time Analysis
Compare multiple time periods
Severity Scoring
Severity scoring (Severe/Moderate/Mild)
Recovery Tracking
Monitor content recovery
Key Features
Flexible Time Periods
- 28 DaysQuick monthly snapshot for recent changes
- 3 MonthsQuarterly analysis for seasonal patterns
- 6 MonthsSemi-annual review for long-term trends
- 1 YearAnnual comparison for comprehensive analysis
Customisable Thresholds
Multi-Metric Tracking
Primary Metrics
- • Click-through rate (CTR)
- • Search impressions
- • Average position
- • Total clicks
Calculated Metrics
- • Decay velocity
- • Severity score
- • Recovery rate
- • Traffic lost
Getting Started
Prerequisites
- ✓ProRank SEO Pro license or higher
- ✓Google Search Console connected with 30+ days of data
- ✓WordPress 6.0+ with cron jobs enabled
Initial Setup
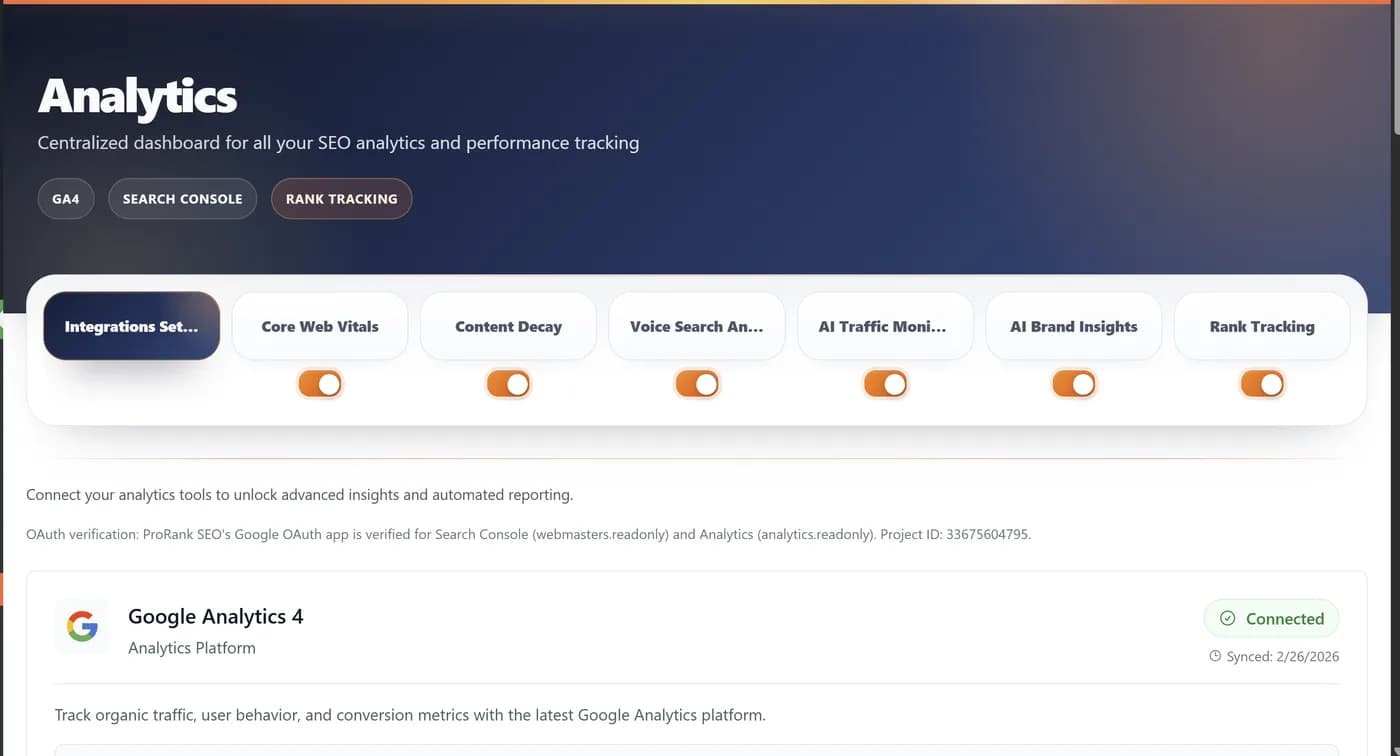
- 1. Connect Google Search Console
ProRank SEO → Analytics → Integrations Setup → Google Search Console → Click "Connect Search Console" → Authorize access → Select verified property - 2. Access Content Decay Monitor
ProRank SEO → Analytics → Content Decay → Choose between the "Dashboard", "Analytics", "Export", or "Settings" tabs - 3. View Your Data
- • Dashboard: Runs decay analysis and shows decline metrics with filters
- • Analytics: Shows chart visualisations of decay trends
- • Pages are automatically categorized by severity (Severe/Moderate/Mild)
Understanding Severity Levels
The Content Decay Monitor categorises declining content into three severity buckets based on performance drop:
Priority Matrix
Use this matrix to determine which declining content to address first based on traffic volume and decay rate:
| Traffic Volume | Decay Rate | Priority | Action Timeline |
|---|---|---|---|
| High | Rapid | Critical | Immediate |
| High | Moderate | High | Within 3 days |
| High | Gradual | Medium | Within week |
| Medium | Rapid | High | Within 3 days |
| Medium | Moderate | Medium | Within 2 weeks |
| Low | Any | Low | As resources allow |
Recovery Strategies
Rapid Decay>50% traffic loss
- 1. Check for manual actions or penalties
- 2. Verify technical issues (404s, redirects)
- 3. Analyse SERP changes and competitor content
- 4. Perform emergency content update
- 5. Build fresh, relevant backlinks
Moderate Decay30-50% traffic loss
- 1. Update outdated statistics and information
- 2. Add FAQ section with current questions
- 3. Enhance E-E-A-T signals
- 4. Improve page speed and Core Web Vitals
- 5. Optimise for featured snippets
Gradual Decay20-30% traffic loss
- 1. Schedule regular content updates
- 2. Perform seasonal optimisation
- 3. Align with current user intent
- 4. Enhance mobile experience
- 5. Improve internal linking
Best Practices
Daily Checks (5 min)
- • Review critical alerts
- • Check top 5 declining pages
- • Note unusual patterns
Weekly Analysis (30 min)
- • Run fresh analysis
- • Review all declining pages
- • Prioritize updates
- • Schedule tasks
Monthly Review (2 hours)
- • Comprehensive analysis
- • Compare trends
- • Update calendar
- • Report results
Prevention Strategies
- →Quarterly Audits: Full-site content reviews every 3 months
- →Proactive Updates: Annual statistics refresh for all content
- →Content Calendar: Schedule regular review cycles
- →Impact Tracking: Measure update effectiveness
API Access
Developers can access Content Decay data programmatically via REST API:
// Get WordPress posts for monitoring
GET /wp/v2/posts?per_page=50&orderby=modified&order=asc

// Get decay analysis results (backend ready, frontend integration pending)
GET /wp-json/prorank-seo/v1/content-decay

// Trigger new analysis
POST /wp-json/prorank-seo/v1/content-decay/analyze
{
"period":"28days",
"threshold": 20
}

// Export decay data
GET /wp-json/prorank-seo/v1/content-decay/export
Frequently Asked Questions
How often should I run decay analysis?
For most sites, weekly analysis is optimal. High-traffic sites may benefit from daily checks, while smaller sites can use bi-weekly or monthly schedules.
What causes content decay?
Common causes include algorithm updates, increased competition, outdated information, seasonal changes, technical issues, and shifts in user intent.
How long before seeing recovery?
Recovery timelines vary: Minor updates (2-4 weeks), Major refreshes (4-8 weeks), Complete rewrites (8-12 weeks). Results depend on crawl frequency and competition.
What's the minimum traffic for accurate detection?
For GSC-based decay detection, pages need at least 10 clicks in the comparison period. The Dashboard tab uses content age as a proxy for decay, which works for all content regardless of traffic.
Is Google Search Console data required?
GSC is recommended for accurate traffic-based decay detection. However, the Dashboard tab can list posts by modification date even without GSC connected, but decay scoring requires GSC data.