Core Web Vitals
Core Web Vitals monitoring with real-time measurement, historical charts, and Chrome UX Report data.
Overview
Core Web Vitals are Google's essential metrics for measuring user experience. ProRank SEO provides a monitoring dashboard with real-time measurement, historical charts, PSI/CrUX-backed data, and diagnostics to help you track your site's performance.
LCP - Loading
Largest Contentful Paint measures loading performance. Target: under 2.5 seconds
INP - Interactivity
Interaction to Next Paint measures responsiveness. Target: under 200 milliseconds
CLS - Stability
Cumulative Layout Shift measures visual stability. Target: under 0.1
Key Features
CWV Dashboard
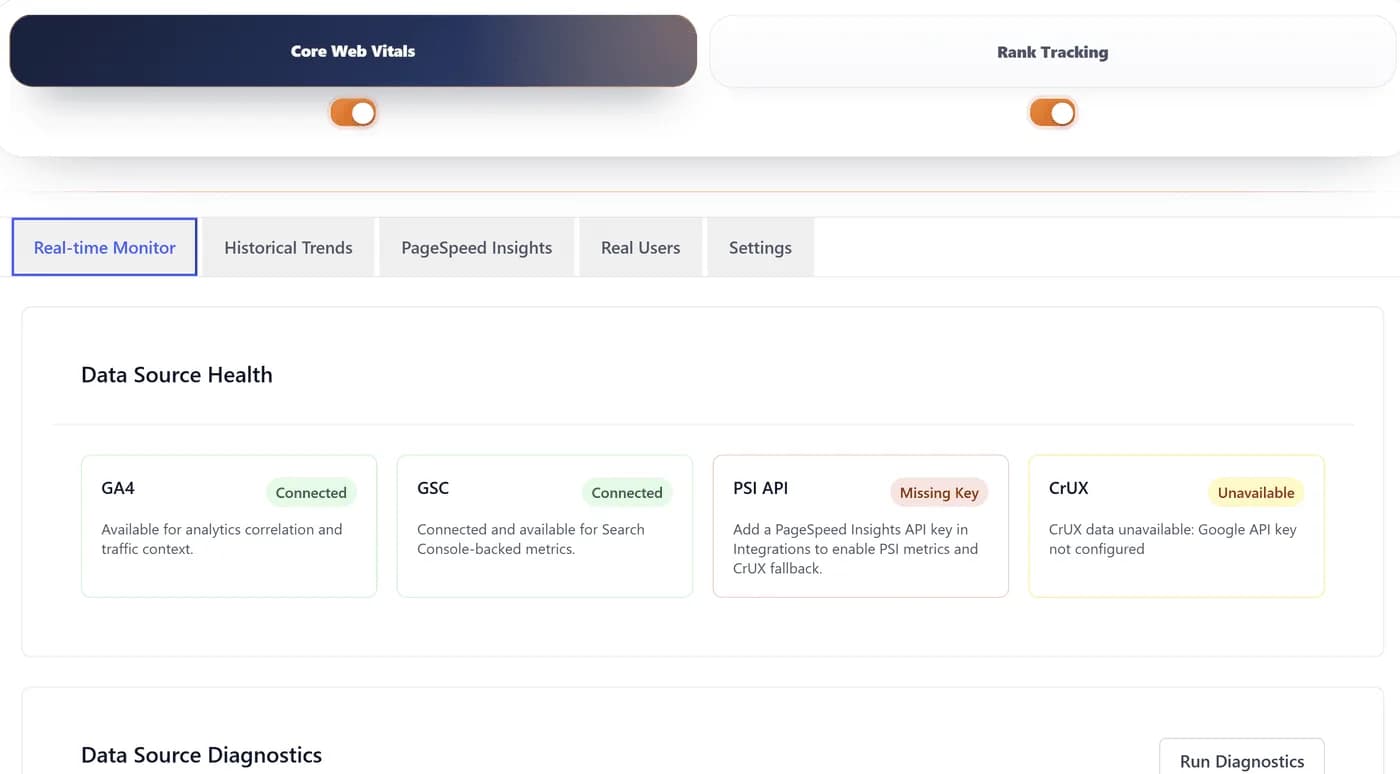
The CWV Dashboard is available under ProRank SEO → Performance → Core Web Vitals. It provides an overview of your site's Core Web Vitals using data from PageSpeed Insights and the Chrome UX Report (CrUX).
Dashboard Features
- Overview charts powered by Chart.js
- PSI and CrUX-backed metric data
- Diagnostics and configuration checks
- Date, URL, and device type filtering
- Color-coded Good / Needs Improvement / Poor ratings
Chrome UX Report (CrUX) Data
When available, the dashboard displays real-user field data from Google's Chrome User Experience Report, including P75 values and Good/Needs Improvement/Poor distribution.
Best Practices
Daily Monitoring Workflow
- Check dashboard each morning for overnight changes
- Address any new issues immediately
Optimisation Priority
- Fix Poor ratings first - These directly impact user experience
- Improve Needs Improvement ratings - Prevent them from becoming poor
- Maintain Good ratings - Regular monitoring to prevent regression
- Metric Priority: LCP → INP → CLS → FCP → TTFB
Troubleshooting
Common Issues
No Data Showing
- Ensure JavaScript is enabled in your browser
- Check that web-vitals library is loading (v4.x)
- Wait 5-10 seconds for initial measurements
- Check browser console for errors
Different Scores from PageSpeed Insights
- Our tool measures real-time performance in your browser
- PageSpeed Insights uses lab data from controlled environments
- Network conditions and device capabilities affect scores
- Both measurements are valuable for different purposes
Metrics Not Updating
- Clear browser cache and reload
- Disable ad blockers temporarily
- Check REST API endpoints are accessible
- Verify database table exists and is writable
Frequently Asked Questions
How often should I check Core Web Vitals?
Check daily for critical pages, weekly for all important pages, and immediately after any major changes.
Why do scores fluctuate?
Scores vary based on network conditions, server load, browser cache state, third-party scripts, and user location.
What's the difference between field and lab data?
- Field data (CrUX): Real user measurements from Chrome browsers
- Lab data: Controlled testing environment measurements
- Both are important for complete performance understanding
Should I aim for perfect scores?
Focus on meeting the "Good" thresholds first. Perfect scores aren't always necessary or practical. Prioritize user experience over perfect metrics.